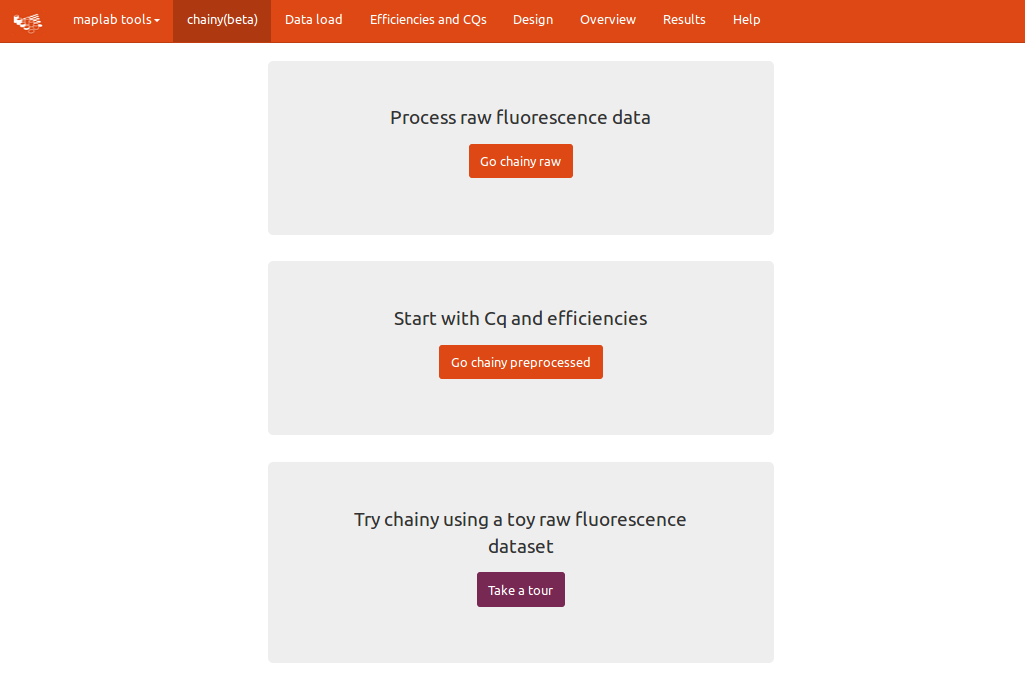
Process raw fluorescence data
Start with Cq and efficiencies
Try chainy using a toy raw fluorescence dataset
Chainy provides a platform for the comprehensive analysis of real-time, quantitative PCR data. Starting with a raw fluorescence data file, chainy will estimate CQs and efficiencies; if a second file describing the experimental design is uploaded, relative quantification coupled to reference gene stability assessment wil be performed.
Data load
Please upload a file containing the fluorescence raw data before baseline subtraction.Experiment design
Thanks for using chainy!
Chainy is a cross-platform web tool providing systematic pipelines and steady criteria to process RT-PCR data.
If you find Chainy useful please consider citing our paper:
- Izaskun Mallona, Anna Diez-Villanueva, Berta Martin and Miguel A. Peinado (2017). Chainy: an universal tool for standardized relative quantification in real-time PCR Bioinformatics, 33(9):1411-1413.
Detailed info on usage can be found as supplementary material.
Take a tour
Chainy is built with an example dataset that can be run pressing the take a tour purple button found at its homepage. This data comes from the Vermeulen's paper on neuroblastoma. The design for this experiment includes ALUsqEurogentec, HMBS, SDHA1 and UBC2 as references and HPRT1 as target. Two groups have been taken, b as treated and a as control (these are random groups built on the Vermeulen dataset: a corresponds to samples 1495, 1496, 1497, 1498, 1499, 1500, 1501, 1503, 1507 and 1508; and b to 1832, 1834, 1835, 1836, 1837, 1839, 1840, 1841, 1842, 1844).
First, select the purple button to launch the example dataset.
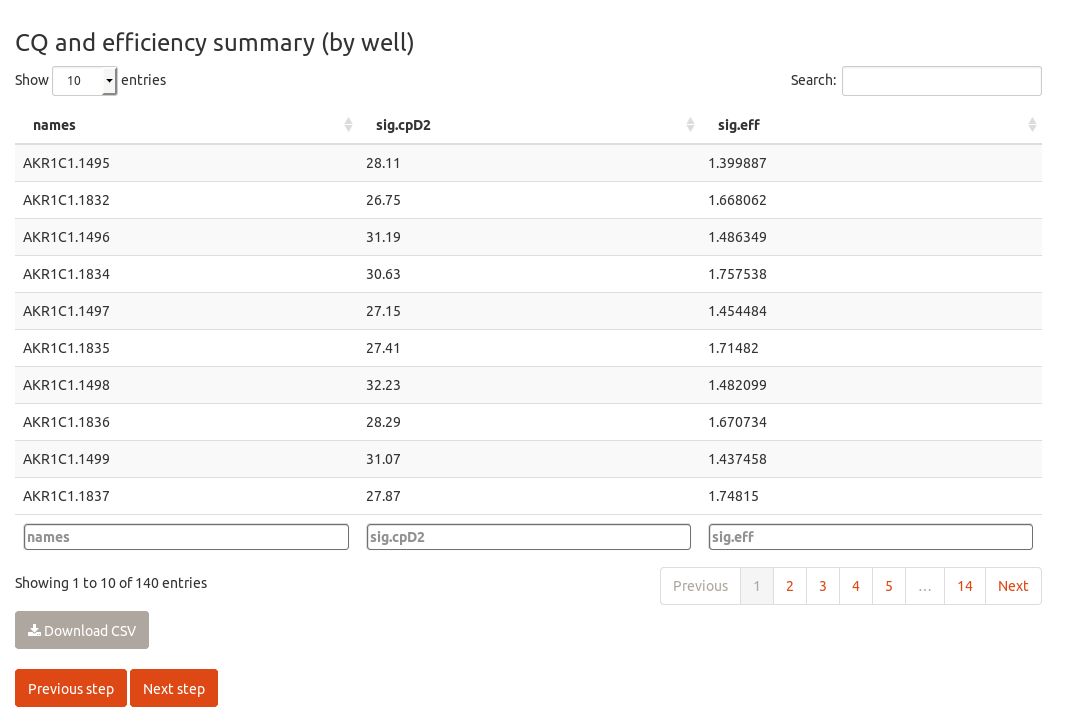
This will focus on the tabpanel for CQ and efficiency calculation by kinetic methods. On top, there is a browsable image in which you can check the amplification plots; then, a datatable that summarizes the calculated crossing points and efficiencies, as well a button to download it.
Note that chainy runs a method to tag outliers according to their lack of sigmoidal structure. The name of these putative outliers will be printed flanked by asterisks. For instance, if you labed some reaction as 'A1 water ACT' and the model to detect the amplification fails to fit, its name will turn out to be 'A1 water ACT'.
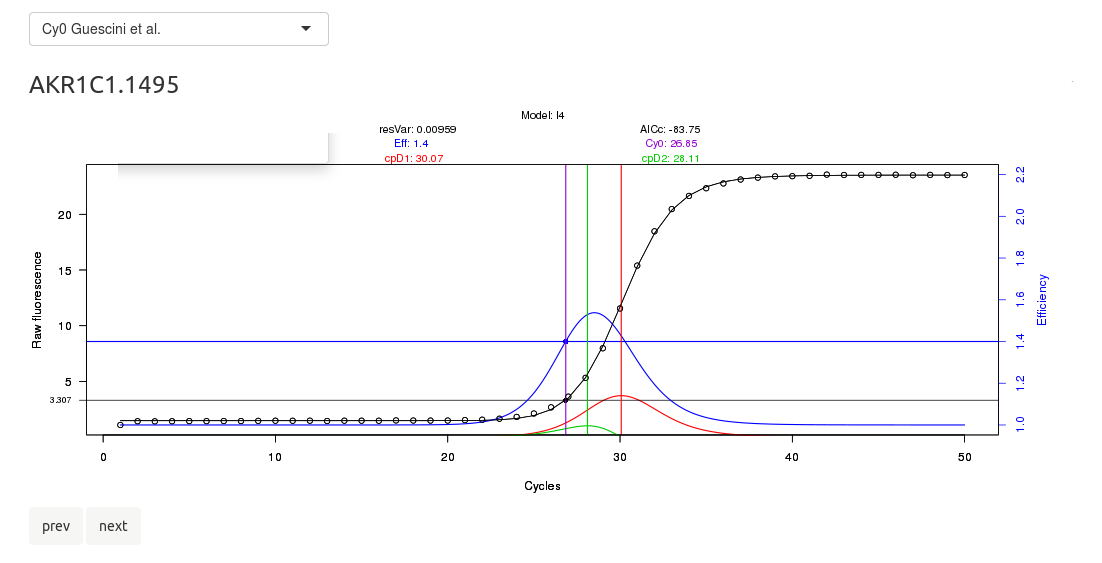
Please check the upper select box, in which the algorithm to perform the kinetic fitting can be changed.
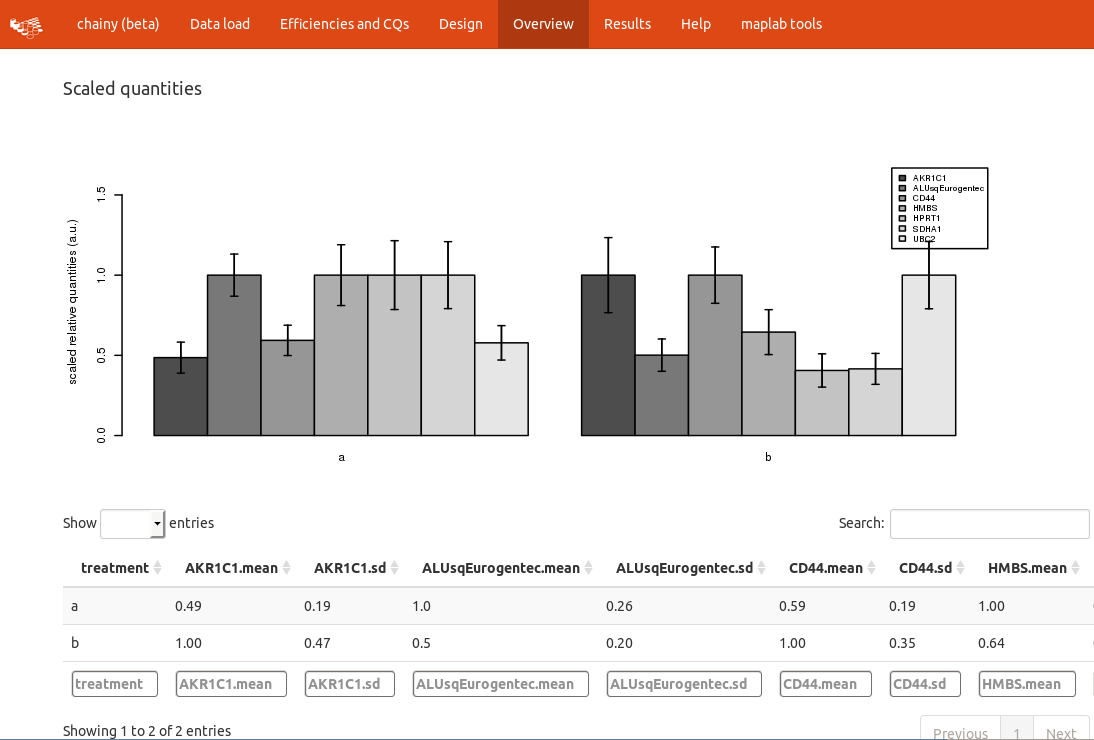
The next step is to check the overall amplification pattern by computing the relative quantities, just scaling them to the sample with the highest expression. Note that no normalization is performed here, chainy just collapses the technical replicates and looks for technical variability. Hence, the scaled quantities are highly dependent on the starting amount of template and cannot be directly compared without further normalization.
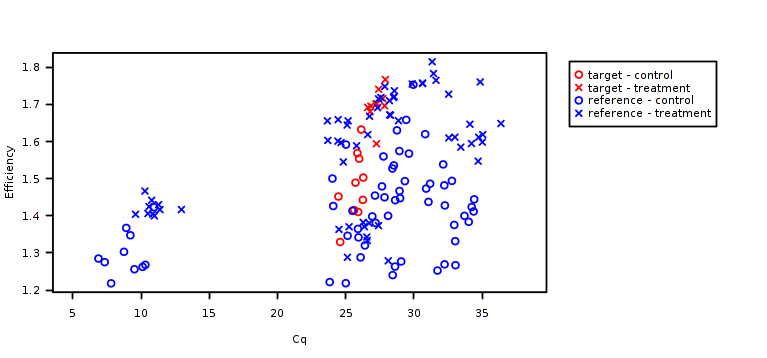
Failing technical replicates as well outliers and, in a broad sense, the amplification trends might be detected by checking the crossing points vs efficiency plot.
The last step is to perform the relative quantification building a normalization factor and measuring its stability. In this usage tour, chainy already knows the experimental design and does not ask for explicit primers and treatments annotation (that is, references or targets; and samples or controls). If you run chainy with custom data an intermediate step to fill this information will appear.
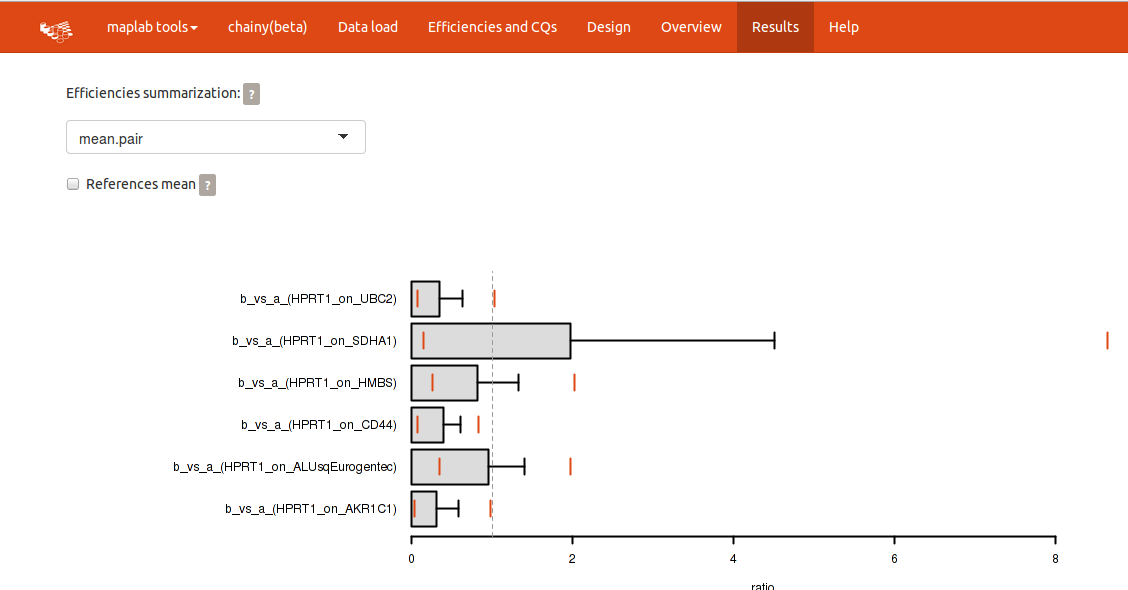
Please notice the upper panel, in which the efficiency summarization method and whether the references should be averaged or not can be readily changed.
The expression barplots reflect the expression ratio of each treatment against a normalization factor built using all the introduced reference genes. By clicking the checkbox for references mean you can compute expression ratios against each reference gene separately. Plots and tables will be modified accordingly.
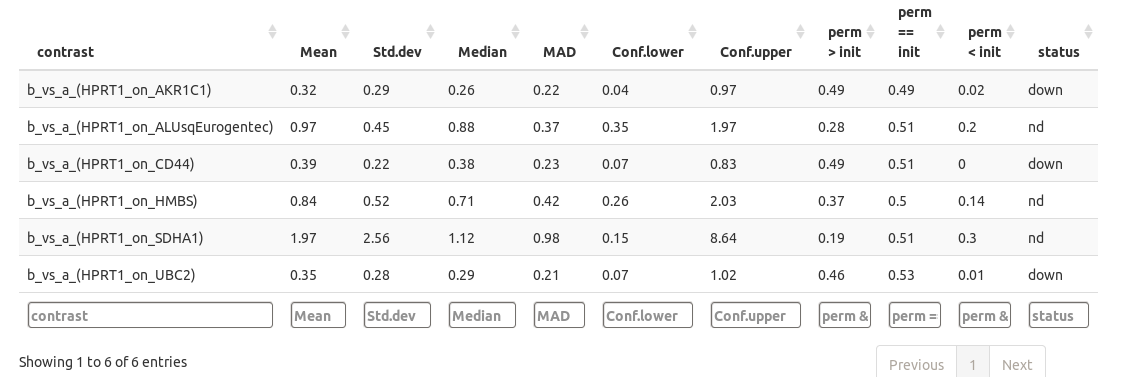
The quantification results are available as datatables (please notice you can sort and filter the columns).
Finally, the reference genes are checked for expression stability.
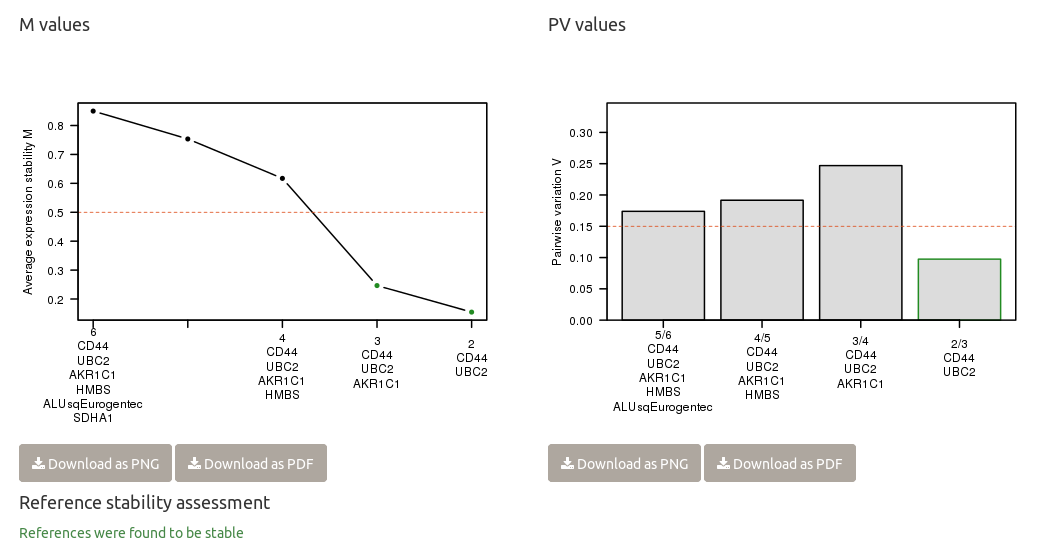
Chainy evaluates the suitability of references by the standard geNorm method providing a ranking based on their stability. The optimal normalization factor with the minimum number of genes (lower V value) and the highest stability (lower M value) is also reported.
Usage scenarios
chainy is designed for three use case scenarios. Test datasets are available to play with. Although they are plain text (tab delimited), they can be opened with any spreedsheet processor, such as MS Word or LibreOffice calc; and of course with text editors (gedit, notepad++).
- start with fluorescence data and get CQs and efficiencies. The required input is the fluorescence file (download example fluorescence delim).
- start with fluorescence data and quantify and assess reference stability. Requires the fluorescence file and an, later, the annotation file (download example delim, download example design).
- process CQs and efficiencies to quantify and evaluate reference stability. Will ask for an annotation file containing the CQs and efficiencies (download example processed).
Data load
chainy accepts tab-delimited data inputs summarizing the fluorescence raw data. However, for some thermocyclers (lightcycler, mx3000p, applied), chainy parses machine-specific data inputs as well.
IMPORTANT: Mind that data must be only for the SYBR Green / Eva Green dye or Taqman probes. Passive dyes, namely ROX, cannot be processed with Chainy. Data must be extracted as row as possible, without any baseline subtractions or smoothing. Please avoid to export no template controls or runs failed to amplify properly (i.e. those that have weird melting profiles); if not skipped during data export, please annotate them later as not included.
RDML
The vendor-indepedent RDML standard v1.1 and v1.2 can be used as raw fluorescence data inputs. If using Chainy to not only call Cqs and efficiencies, that is to quantify and assess for references stability, using RDML will ease the processing steps as we will take advantage of the thermocycler annotation for targets and treatments to fill the annotation file (please tag the data you'd like to skip as not included within the spreadsheet, though).
Please remember to select which dye to analyze when using multiple fluorochromes (i.e. keep SYBRGreen and filter out the ROX passive dye).
More information on RDML can be found at the RDML project home. Chainy uses the RDML R package to parse RDML data.
A shortlist of thermocyclers allowing RDML export include:
- Bio-Rad (CFX96 and CFX384)
- Life Technologies (StepOne, ViiA7 and QuantStudio)
- Roche (LC96)
- Thermo Fischer (QuantStudio TM 6 and 7 Flex)
- Qiagen Rotorgene Q
- MyGo Pro & MyGo Mini
delim values
A text file with as many rows as amplification cycles and as many columns as reactions plus a first column with integers describing the cycle number (1,2...45). Fields must be tab-separated. Decimal separator is a dot (.). The first row of the file acts as header and must contain the names of each of the wells/tubes. A tab-delimited fluorescence data file is available to download.
| AKR1C1.1495 | AKR1C1.1832 | AKR1C1.1496 | |
|---|---|---|---|
| 1 | 1.087 | 0.469 | 0.957 |
| 2 | 1.422 | 0.627 | 1.199 |
| 3 | 1.414 | 0.615 | 1.212 |
| 4 | 1.422 | 0.623 | 1.207 |
| 5 | 1.435 | 0.635 | 1.223 |
| 6 | 1.431 | 0.611 | 1.208 |
| 7 | 1.443 | 0.623 | 1.215 |
| 8 | 1.439 | 0.623 | 1.207 |
| 9 | 1.457 | 0.611 | 1.208 |
| ... | ... | ... | ... |
| 46 | 23.553 | 23.950 | 25.707 |
| 47 | 23.508 | 23.914 | 25.691 |
| 48 | 23.540 | 23.883 | 25.682 |
| 49 | 23.522 | 23.903 | 25.681 |
| 50 | 23.531 | 23.911 | 25.721 |
Lightcycler
A tutorial on lightcycler raw data retrieval is available as a pdf document (courtesy of Berta Martin). A lightcycler XML fluorescence data file is available to download (right click the link and select to download the file; if not, your browser might try to render the XML).
Applied
Raw fluorescence data must be exported as SDS 2.3 Clipped 1.0. An applied raw fluo data file is available to download.
Efficiencies and CQs
Two parameters can be obtained from each reaction, which will be the basis for data analysis: the CT (cycle threshold; also called quantification cycle or Cq) and the efficiency. The CT is the fractional number of cycles in which the kinetic curve reaches a threshold amount of fluorescence and provides an inverse measure of the starting DNA quantity. Roughly speaking, the efficiency represents the yield of the reaction.
- cpD2, and cpD1 and Cy0 are methods to estimate the crossing points/efficiencies.
- cpD1 calculates the first derivative maximum of the curve and retrieves the fluorescence and the the slope and fluoresce at it; cpD2 does the same but using the second derivative.
- Cy0, described in Guescini et al (2002), fits a tangent to the point of inflection of the modelled curve, being more accurate with some slight PCR inhibition is found.
- CQs, Corbett Research's take-off method based on taking the 20% of the fluorescence value cpD2.
Experimental design
Chainy compares treated samples vs control(s) and therefore asks the user for the annotation of each well/PCR individual run.
If the user started with raw fluorescence data, chainy will compute the efficiency and CQs and will only ask for the primers and treatments for each well. Please note there is a button to download a template to fill: this already has the adequate structure, including the well/tube names from the previous raw fluorescence data input.
If the user already has the processed data, chainy will ask for both the annotation and the CQs and efficiencies.
In both cases, each PCR reaction need a boolean (TRUE/FALSE) annotation to label it as included in the analysis (TRUE) or not (FALSE). Non template controls (NTC) and outliers must be tagged as FALSE.
After uploading this file, chainy will render an interface to ask you to annotate the treatments as samples or controls; and the primers in targets or references.
Differential expression
Chainy quantification returns the ratio of a target amplicon between two samples, the control and treatment. Normalization can be either be against the reference or a normalization factor composed by many references. Quantification ratios are statistically tested by a permutation approach equivalent to the REST software.
Chainy relies on the qpcR R package.
Chainy assesses the fold change between treatments by permutation tests. Briefly, scaled quantities are taken from both groups (i.e. treatment and control) and randomly reallocated 100 times. For each randomization, a treatment vs control ratio is calculated. The number of tests in which the shuffled ratio is below or above the original ratio can be read as a p-value of a test against the null hypothesis that the ratios calculated by permutation are just by chance.\
WARNING: The current version of chainy only accepts experiment design with at least one target and reference; and at least two samples, one being the treated sample and the other its control.
Results interpretation
Each output barplot reflects the mean expression ratio and its whisker, the standard deviation. Two orange lines depict its confidence interval. A superimposed vertical line placed at ratio = 1 (i.e. no changes) divide the plot in overexpression (left) and downregulation (right). Confidence intervals over 1 point to overexpression; and confidence intervals below 1, downregulation. Further statistical significance of the ratio is calculated by a permutation approach of randomly reallocated vs. non-reallocated data (REST-like permutation analysis).
chainy calculates two possible scenarios for quantification changes using permutations: up and downregulation. The 'perm > init' reflect the ratio of the permutations in which, by chance, you could read an upregulation on your data. This value can be broadly interpreted as a pvalue: if below your desired cut-off (i.e. 0.05) it can be said that, by chance, in less 5% of the cases you could read overexpression from your data, so accept the overexpression hypothesis. The 'perm < init' column works the way around, so values below 0.05 will point to downregulation. The last column 'status', however, sums up the permutation analysis results into a 'down', 'ns' (non significant) or 'up' results.
Efficiencies summarization
- individual: The individual efficiencies from each run are used.
- mean.single: Efficiencies are averaged over all replicates.
- median.single: Same as above but median instead of mean.
- mean.pair: Efficiencies are averaged from all replicates of treatment sample AND control.
- median.pair: Same as above but median instead of mean.
Reference gene selection
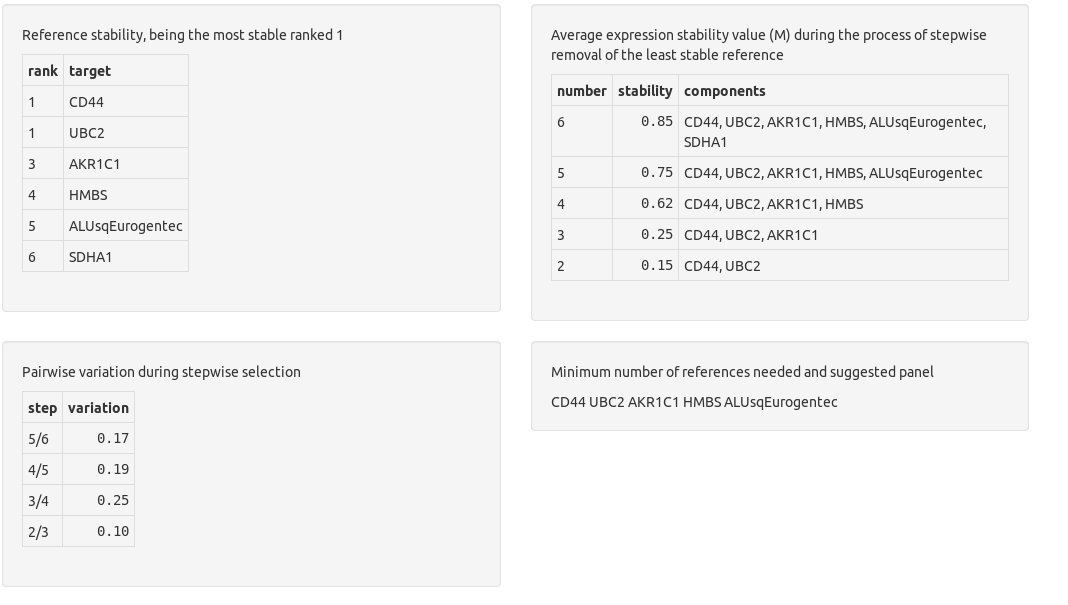
chainy assesses references stability by using the NormqPCR R/Bioconductor package implementation of the geNorm algorithms for M and PV values calculation.
Results interpretation
The M stability values are a inverse measure of reference stability. They were described at the Vandesompele's normalization paper as
For every control gene we determined the pairwise variation with all other control genes as the standard deviation of the logarithmically transformed expression ratios, and defined the internal control gene-stability measure M as the average pairwise variation of a particular gene with all other control genes. Genes with the lowest M values have the most stable expression. Assuming that the control genes are not co-regulated, stepwise exclusion of the gene with the highest M value results in a combination of two constitutively expressed housekeeping genes that have the most stable expression in the tested samples.
Pairwise variation (PV) values allow to select the minimum number of genes needed to build a robust normalization fastor. Again, the authors described them as:
Furthermore, it is a waste of resources to quantify more genes than necessary if all genes are relatively stably expressed and if the normalization factor does not significantly change whether or not more genes are included. Taking all this into consideration, we recommend the minimal use of the three most stable internal control genes for calculation of an RT-PCR normalization factor (NFn, n = 3), and stepwise inclusion of more control genes until the (n + 1)th gene has no significant contribution to the newly calculated normalization factor (NFn + 1). To determine the possible need or utility of including more than three genes for normalization, the pairwise variation Vn/n + 1 was calculated between the two sequential normalization factors (NFn and NFn + 1) for all samples within the same tissue panel (with aij = NFn,i and aik = NFn + 1,i, n the number of genes used for normalization (3 ≤ n ≤ 9), and i the sample index. A large variation means that the added gene has a significant effect and should preferably be included for calculation of a reliable normalization factor.
chainy returns a warning if the M and PV values point to reference panel instability, and suggest the smallest stable panel otherwise. The thresholds are: M values below 0.5; and as many reference genes as to get a pairwise variation value below 0.15.
To easily check reference stability, chainy reports in a single sentence whether the they are stable (in green) or not (in red). At the M plot, reference panels with the M < 0.5 threshold are depicted with a green dot; if greater, they are represented in black. At the PV barplot, reference panels with PV < 0.15 are highlighted with a green border.
Report
The results panel allows to download a zip-compressed set of figures, spreadsheets and logs summarizing the whole analysis as well the parameters used.
Frequently asked questions and troubleshooting
Where are the plots? When uploading my data only tables are generated
For the sake of simplicity, Chainy renders tables summarizing the quantification results. Barplots, however, can be downloaded at the last step of the analysis (download report button).
What does the 'up', 'down' or 'ns' differential expression status mean?
The tag summarizes whether the differential expression is found to be significant according to the permutation test and a threshold of ratio of permutations < 0.05.
Note that this value is not strictly a p-value, as p-values calculated by permutations cannot be 0 (unless performing infinite reallocations).
chainy warns about references instability but nonetheless it includes them into the normalization factor. Why?
chainy evaluates reference gene stability but if the user asks them to be used as references, they are. However, if a subset of these genes are appropriate, chainy will suggest the optimal reference panel. Therefore, you could go backwards and annotate the wells matching the unstable references as 'not included' or, even quicker, choose the unstable references to be targets.
The differential expression tab is empty!
Please press the 'next' button at the previous tab. This will refresh the relative quantification and the reference selection as well. Although the navigation bar (the upper, orange bar) items are clickable, chainy is designed to be browsed by clicking on the 'previous step' and 'next step' buttons.
Plots appear twice!
Please refresh chainy by pressing the F5 key in your keyboard or by entering the webpage again.
I get a 'NA' (empty value) as CQ or efficiency value in some wells!
There are two reasons for the kinetic method not to calculate the Cq or efficiency value.
First, that the fluorescence does not look like an amplification curve, so the sigmoidal model cannot be fitted. This typically happens with non template controls. This result point to a problem with the reaction, and might help to tag outliers. You can check whether this was the case by visually inspecting the amplification plot of that well (the dots represent the fluorescence measures, and the line, the fitted model, if any).
Second, some algorithms are not able to get the Cq and efficiency values even after a succesful sigmoidal fitting of the amplification curve. This is exemplified with the Vermeulen's dataset used as a toy example, in which the Corbett's CQ fails for many wells while the rest of the methods perform fine. If this was your case, we recommend switching the kinetic method.
Can I run Chainy locally?
Please access the Chainy code repository, download the source code and launch run_local_chainy.R (Rscript command will do). The R script will try to install all the dependencies needed. Please note you must have R and a modern web browser installed!
Which Chainy URL should I bookmark?
We kindly ask you to update your bookmarks to the stable address http://maplab.cat/chainy even though you might experience a redirect after visiting our tools. That is, the URL in your browser might change during browsing but, still, we strongly recommend to use the stable URL starting with http:/maplab.cat, as it will always launch the tools no matter where or how do we host it. Thanks!
Can I export RDML from Chainy?
RDML requires annotation Chainy does not ask for (i.e. experimenter names or thermal conditions). Please use the RDML generator by the RDML consortium to do so.
Contact
Please contact Izaskun Mallona or Miguel A. Peinado.
References
chainy takes advantage of the versatile qpcR R package for raw fluorescence management and differential expression; the Bioconductor package NormqPCR form reference stability assessment; and the RDML package for RDML parsing.
- Ritz, Christian, and Andrej-Nikolai Spiess. qpcR: an R package for sigmoidal model selection in quantitative real-time polymerase chain reaction analysis. Bioinformatics 24.13 (2008): 1549-1551.
- Perkins JR, Dawes JM, Orengo C, McMahon SB, Bennett DL and Kohl M (2012). ReadqPCR and NormqPCR: R packages for the reading, quality checking and normalisation of RT-qPCR quantification cycle (Cq) data. BMC Genomics, 13, pp. 296+.
- Blagodatskikh, KA; Roedige, S; and Burdukiewicz, M. RDML package at CRAN.
Chainy uses a subset of the Vermeulen dataset as toy dataset.
- Vermeulen, Joëlle, et al. Predicting outcomes for children with neuroblastoma using a multigene-expression signature: a retrospective SIOPEN/COG/GPOH study. The lancet oncology 10.7 (2009): 663-671.
chainy follows the Vandesompele's normalization strategies.
- Vandesompele, Jo, et al. Accurate normalization of real-time quantitative RT-PCR data by geometric averaging of multiple internal control genes. Genome biology 3.7 (2002): research0034.
Technical details
Chainy is open and free for the academic community and there is no login requirement. chainy does not store any users data. All the computations are performed at the chainy's server, and thus can be accessed from commodity computers, such as low-memory laptops, as far as they use a modern web browser.
Chainy adaptively resizes its content to be rendered in a wide range of screens, from lab computers or laptops to tablets and other mobile devices. The relative expression plots, however, might be difficult to browse if many comparisons are provided (i.e. > 20).
Chainy is written in R/shiny and licensed under the GPL terms. You can browse the source code at the chainy project at bitbucket (we deploy the master branch but you can find the develop, hotfix and crazy feature branches there as well).
Based on Bootstrap using Bootswatch United. Icons from Font Awesome. Web fonts from Google.
About us
chainy was developed at the Miguel A. Peinado's lab. The main focus of our research is the characterization of the molecular mechanisms underlying cancer cell programs and the identification of molecular markers with clinical applications.
Please check more details on the lab and our toolshed at maplab.cat.
We are continuously releasing new epigenetics data visualization and integration tools. You might also like:
- Wanderer, an interactive viewer to explore DNA methylation and gene expression data in human cancer (Epigenetics & Chromatin 2015, 8:22).
- Methylation plotter, a web tool for dynamic visualization of DNA methylation data (Source Code for Biology and Medicine 2014, 9:11).
- The Alu knowledgebase, an ontology of the human Alu repeats.
About chainy
Aim
Real-time quantitative PCR (Q-PCR) is a powerful tool to quantify DNA in a wide range of settings. Relative quantification is present in the majority of Q-PCR set-ups. Basically, it consists in referring the quantification of the analyte to another (the reference) that is supposed to not vary within the experimental conditions. This approach gives an enormous flexibility to the quantification as does not require knowing, a priori, the global amount of template.
From reverse-transcribed mRNA quantification (RT-PCR) to chromatin immunoprecipitation (ChIP) experiments, relative quantification share a common structure with two elements, products and samples. Products are either targets or references, and samples are either treatments or controls. For this reason, almost every experimental design can be analyzed using a similar quantification procedure. However, there are many Q-PCR dataflows, and differences in them lead to noticeable changes in results. Commercial and free software solutions have been developed to address either the whole Q-PCR data analysis or parts of it, such as the reference gene selection or kinetic efficiency estimation. However, the availability of open-source, user-friendly tools to handle real-time PCR data is scarce.
chainy provides an easy-to-use interface that uniformize data analysis, enforcing reproducibility while simplifying the procedure from the raw fluorescence data to the relative quantification, including references stability assessment.
Source code
chainy is free software: you can redistribute it and/or modify it under the terms of the GNU General Public License as published by the Free Software Foundation, either version 3 of the License, or (at your option) any later version.
chainy is distributed in the hope that it will be useful, but WITHOUT ANY WARRANTY; without even the implied warranty of MERCHANTABILITY or FITNESS FOR A PARTICULAR PURPOSE. See the GNU General Public License for more details.
You should have received a copy of the GNU General Public License along with chainy. If not, see http://www.gnu.org/licenses/
chainy git repository is hosted at https://bitbucket.org/imallona/chainy .
Contact
Any feedback is welcome!
Please contact Izaskun Mallona or Miguel A. Peinado
maplab 2015 and 2016 - Designed by Izaskun Mallona. Logo by Julien Douet.